Hey, Ive had this issue with the line graphs for a few years actually and is a major reason why I havent bought the premium. if you have activated a premium trial in the past and used the line graphs, then the trail runs out and at some later date you repurchase the premium, new simply statistics resume from the final date of when your last premium period ended and keep adding on from there. THere are some examples below. On my other account the line graph is now lagged by over a year, deleting and remaking them doesnt change it. Am I just doing something wrong?
Thanks
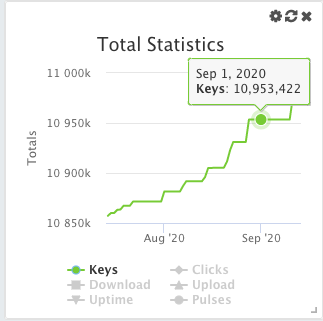
Heres an example from my other profile, showing time periods from last year
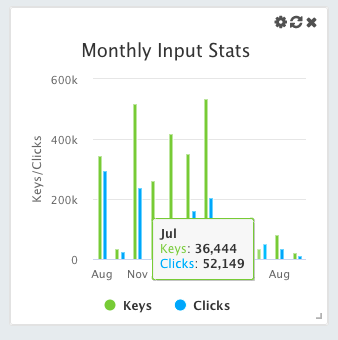
and another from the bar graph